Introduction
Radix uses Prometheus and Grafana to provide nodes and gateways with a real-time monitoring and alert system. Prometheus reads from metrics API endpoints of the node and gateway, and stores it as time series data. Grafana reads this time series data and uses it to build monitoring dashboards for displaying node information and alerts in real-time.

The Prometheus/Grafana installation has been packaged as part of the babylonnode script. This will allow node runners to get a monitoring dashboard up and running by simply running the script and answering a few questions.
You can still setup a Prometheus/Grafana dashboard if you haven’t used the
babylonnodescript to setup your node, but this guide doesn’t cover it.
Prerequisites
It probably goes without saying that before you can install the node monitoring software, you must have a node and/or gateway up and running. If you haven’t, then run through one of our guides which will show you how to do it. Start by reading the Node Setup Introduction to work out which service/s to run.
Monitoring can be set up on the same host as an existing setup, or on another host. Monitoring also includes a database, so can cause increased IO contention. For that reason, we’d recommend running it on a separate host, with connections to the other host/s.
Before you start, you must have the babylonnode CLI installed on the host you intend to install monitoring.
If running monitoring on a separate host, we’d recommend the following (or equivalent) specs:
Model | vCPU | Memory | Storage | Network Bandwidth | Operating System |
|---|---|---|---|---|---|
t3.medium | 2 | 4 GB | Provision a gp2 storage volume. You should initially provision 60 GB of SSD space | At least 100 Mbps |
1. Set up the Nginx Metrics password
In order to make sure the node/gateway is secure as possible, the metrics API endpoint is configured with a separate password in the nginx layer.
On each host with a node or gateway, we need to set up the username/password for this endpoint. Run one of the following babylonnode commands (depending on your installation type) to set up the endpoint’s authorization.
Docker
If PostgreSQL is running locally, this command may not respond. In that case, it is advised to stop the deployed software using command babylonnode docker stop and then run this command.
babylonnode auth set-metrics-password -m DOCKERsystemd
If you are running a systemd node then you must first change to the
radixdltuser:
sudo su - radixdltThen run the below command to setup password
babylonnode auth set-metrics-password -m SYSTEMD2. Set up the monitoring service
This step will be performed on the host you wish to install monitoring.
The monitoring exposes a user dashboard on port 3000 on your server, so make sure that this port is open and available for Grafana to use.
The monitoring setup is split into two commands:
the config command is used to create a config file for monitoring. This allows to persist configuration that you may customise and does not get overwritten during an update
the install command is used to install the monitoring using the config file
2.1. Create config file for monitoring setup
A separate config.yaml file is used for monitoring than the one created for CORE and GATEWAY. By default, it lives at ~/monitoring/config.yaml
There are easy commands to configure monitoring with a Core (on the same host as monitoring, or another host), or with a Core and Gateway (on the same host as monitoring, or on a single other host). For other use cases, check out the Advanced setup.
Core (same host)
babylonnode monitoring config \
    -m MONITOR_CORE \
    -cm [metrics_password]
Setup mode selected here as MONITOR_CORE. This only setups config for monitoring core node.
The password for the metrics user that was configured in the previous step.
The username for the metrics user is typically metrics, but can be set to something else if the host was configured using the DETAILED config mode.
Core (other host)
NODE_HOST_IP_OR_NAME=<host ip or dns name>:<port> \
babylonnode monitoring config \
    -m MONITOR_CORE \
    -cm [metrics_password]
The host of the Core, and the optional :port to its metrics endpoint (if nonstandard)
Setup mode selected here as MONITOR_CORE. This only setups config for monitoring core node.
The password for the metrics user that was configured in the previous step.
The username for the metrics user is typically metrics, but can be set to something else if the host was configured using the DETAILED config mode.
Core & Gateway (same host)
babylonnode monitoring config \
    -m MONITOR_CORE MONITOR_GATEWAY \
    -cm [metrics_password]  \
    -gm [metrics_password]  \
    -am [metrics_password]
The setup mode is selected here as MONITOR_CORE and MONITOR_GATEWAY. This creates config for monitoring both the core full node and gateway.
The password for the metrics user that was configured in the previous step. This is for the core full node where nginx protects path /prometheus/metrics.
The password for the metrics user that was configured in the previous step. This is for the network gateway’s gateway api where nginx protects path /gateway/metrics.
The password for the metrics user that was configured in the previous step. This is for the network gateway’s data aggregator where nginx protects path /aggregator/metrics.
The parameters cm , gm , am are separate, although in many cases they will share the same password. The options are separate to allow running the services on different hosts, where separate passwords may be used.
The username for the metrics user is typically metrics, but can be set to something else if the host was configured using the DETAILED config mode. In that case, see the Advanced setup.
Core & Gateway (single other host)
NODE_HOST_IP_OR_NAME=<host ip or dns name>:<port> \
babylonnode monitoring config \
    -m MONITOR_CORE MONITOR_GATEWAY \
    -cm [metrics_password]  \
    -gm [metrics_password]  \
    -am [metrics_password]
The host of the Core and Gateway, and the optional :port to its metrics endpoints (if nonstandard)
The setup mode is selected here as MONITOR_CORE and MONITOR_GATEWAY. This creates config for monitoring both the core full node and gateway.
The password for the metrics user that was configured in the previous step. This is for the core full node where nginx protects path /prometheus/metrics.
The password for the metrics user that was configured in the previous step. This is for the network gateway’s gateway api where nginx protects path /gateway/metrics.
The password for the metrics user that was configured in the previous step. This is for the network gateway’s data aggregator where nginx protects path /aggregator/metrics.
The parameters cm , gm , am are separate, although in many cases they will share the same password. The options are separate to allow running the services on different hosts, where separate passwords may be used.
The username for the metrics user is typically metrics, but can be set to something else if the host was configured using the DETAILED config mode. In that case, see the Advanced setup.
Advanced
babylonnode monitoring config \
    -m DETAILED
Setup mode selected here as DETAILED. This will walkthrough you with a series of questions to setup config file appropriately.
Alternatively you can manually edit the config file that is created from other commands to point to the right values of the monitored host.
2.2. Run setup to install and run monitoring
When the monitoring has been configured, you can now run the script to set up monitoring:
babylonnode monitoring installAnd that’s pretty much it.
3. Accessing the dashboard.
From the monitoring host, you can view your node’s dashboard remotely using any browser, using this URL pattern:
http://<monitoring-host-ip>:3000/d/radix_node_dashboard/radix-node-dashboard?orgId=1&refresh=5sThe monitoring-host-ip is the external IP address of your host where monitoring is running.
Grafana will display a page asking for your username and password.
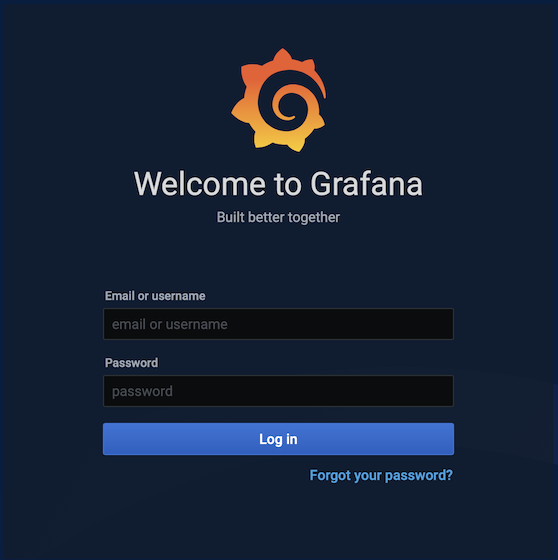
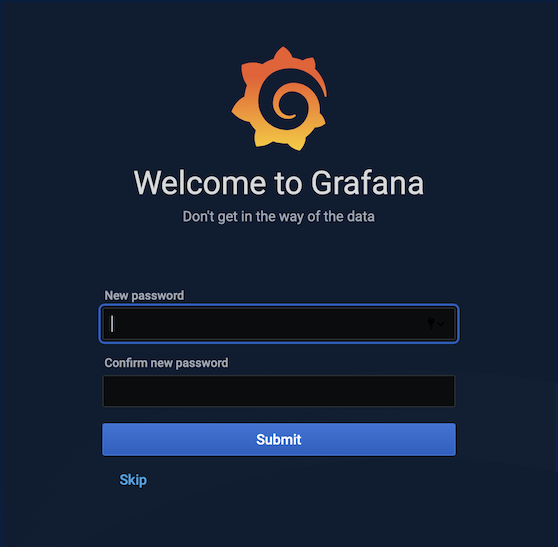
Since this is the first time you’ve run the monitor, enter admin for the username and admin again for the password. Grafana will now display another dialog asking you to change the password for the admin user.
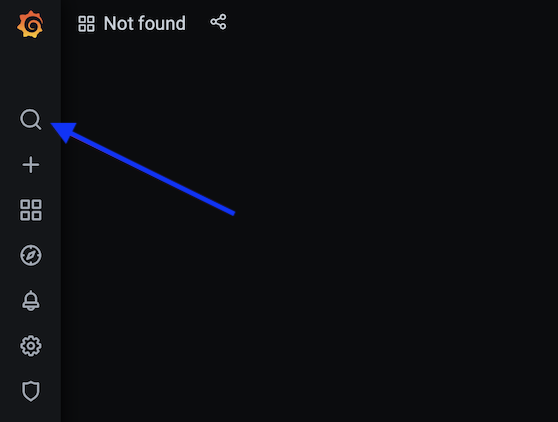
You will now see a blank page with a somewhat discouraging Not Found message at the top. Click the Search icon (the magnifying glass).
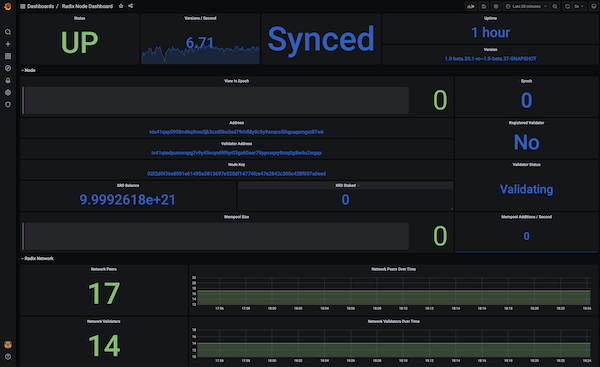
Navigate to Dashboards > Radix Node Dashboard:
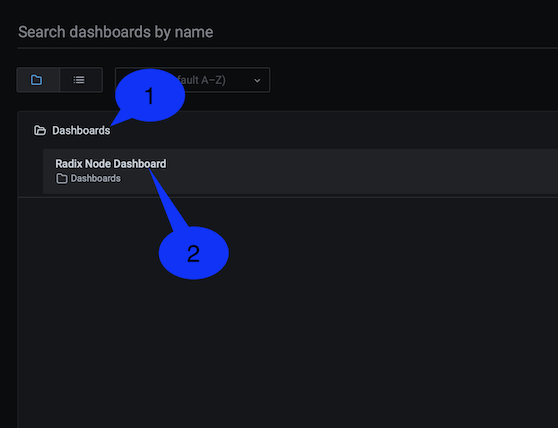
Grafana will now the example dashboard:
4. Accessing the metrics endpoint
Now that the dashboard is up and running, you may want to add new elements yourself, or use the data from the node to build other applications for monitoring and gathering information.
The same data that Grafana uses to build its screen is available on the metrics endpoint/s:
# Core node:
curl -X -k GET --location "https://CORE_NODE_HOST:METRICS_PORT/prometheus/metrics" -H "Content-Type: application/json" --basic --user metrics:nginx-password

# Network Gateway - Data Aggregator
curl -X -k GET --location "https://DATA_AGGREGATOR_HOST:METRICS_PORT/aggregator/metrics" -H "Content-Type: application/json" --basic --user metrics:nginx-password

# Network Gateway - Gateway API
curl -X -k GET --location "https://GATEWAY_API_HOST:METRICS_PORT/gateway/metrics" -H "Content-Type: application/json" --basic --user metrics:nginx-password
Where nginx-password is the password you set up earlier.
5. Shut down Node monitoring
To shut down the monitor on the monitoring host, use the following command:
babylonnode monitoring stopMore information on using babylonnode
You can use babylonnode to carry out a variety of administrative tasks.
For a full reference on the commands the babylonnode CLI offers, please see the documentation on the CLI GitHub repository.
If you have any questions or run into problems, you can get support from the Radix team members and our fantastic community on our Discord server.